Car Pooling - Methodology and Case of Study on Pisa and Florence
Passengers and Drivers
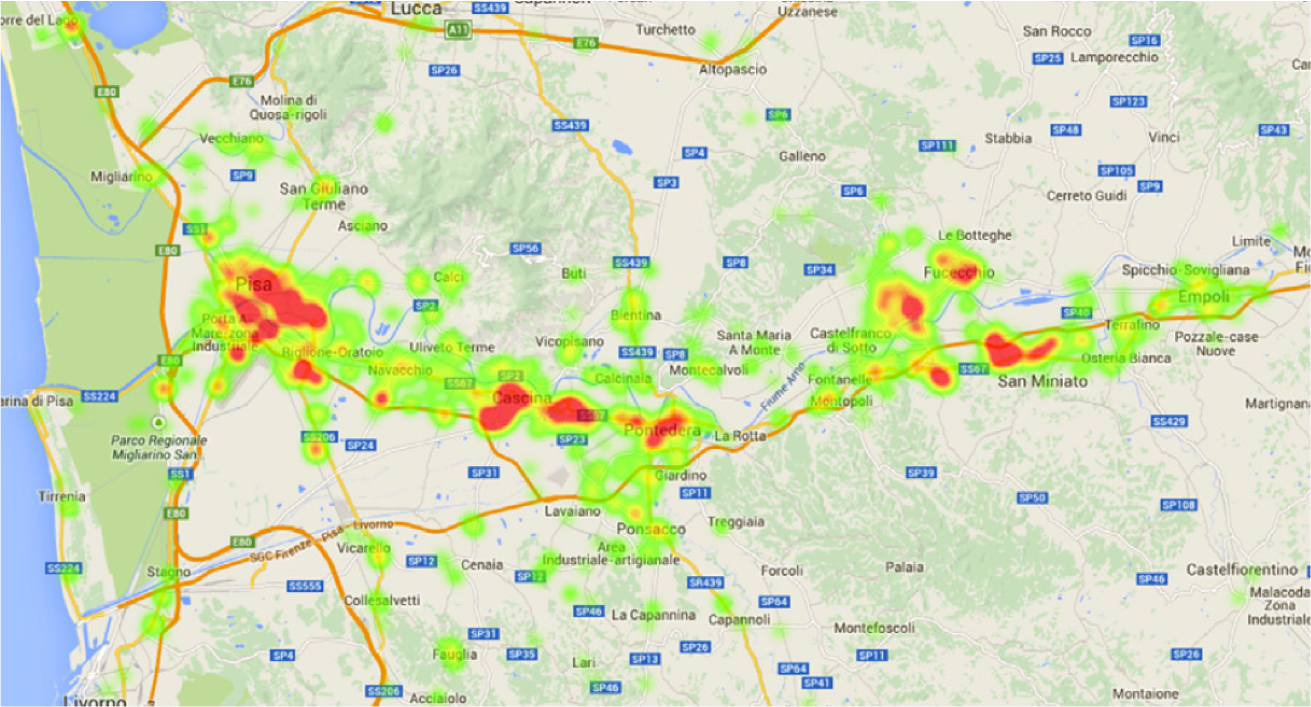
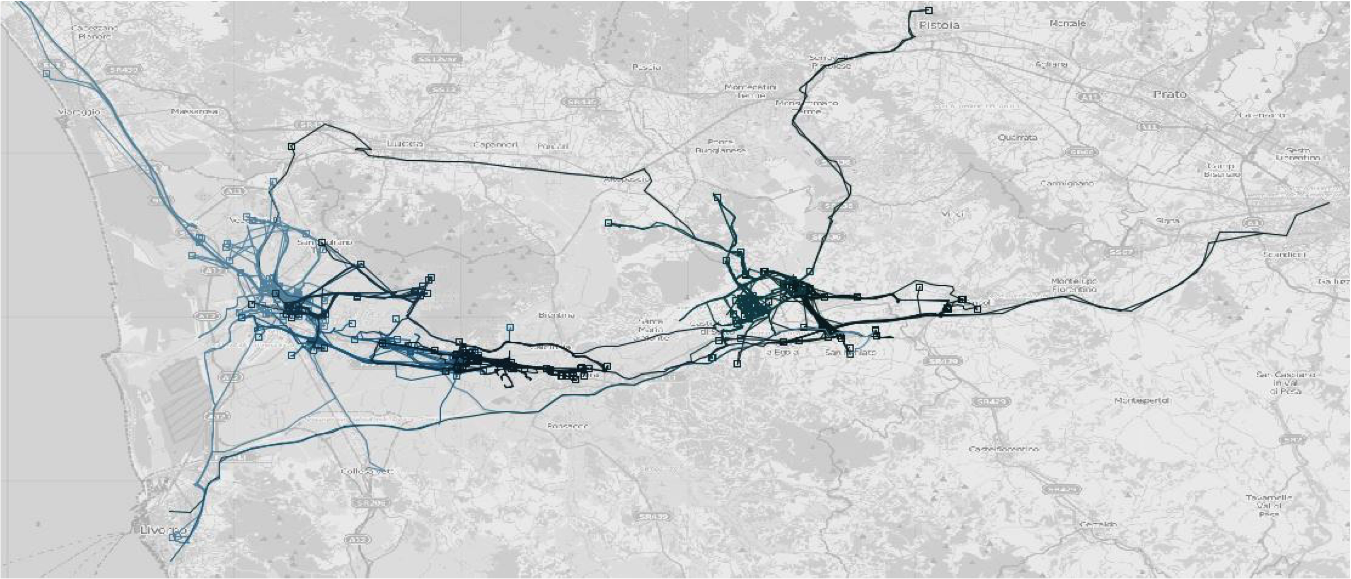
The tool is able to suggest a set of possible matchings to the users according to their habits in terms of their mobility profiles . The heat map shows the most common location for pick-up in Pisa and surrounding area.
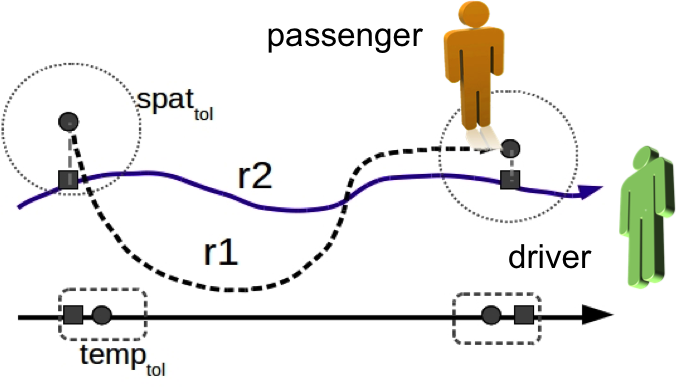
In this example the routine r1 is contained in routine r2 because the starting and ending points of r1 (circular points) are spatially and temporally close enough to some points of r2 (squared points).
Impact of Carpooling
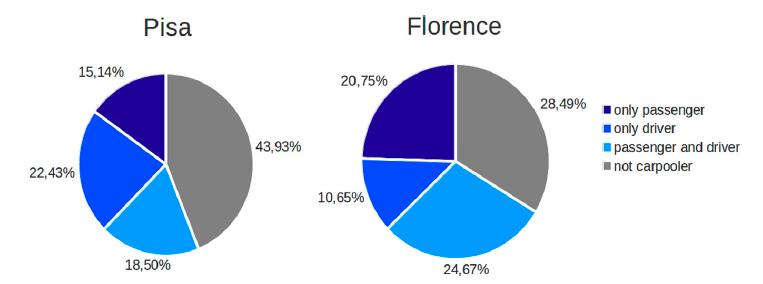
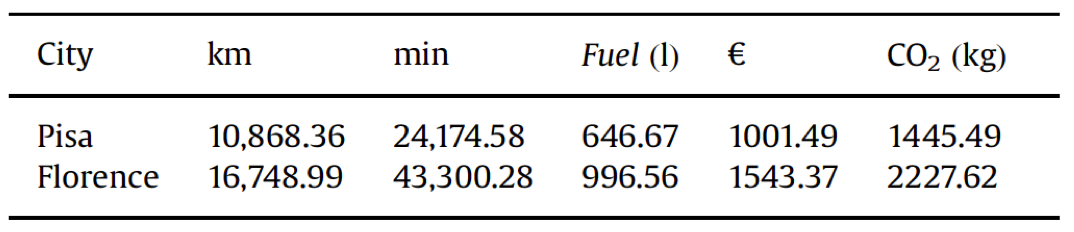
Applying it to Pisa and Florence city and surrounding it is possible to estimate how many people may be classified as Passenger or Diver (or both). Moreover it is possible to estimate the total potential savings in a normal single day obtained by using the proactive carpooling NeverDriveAlone. Savings are expressed in terms of total kilometers driven, time spent driving, fuel consumed, its cost and CO2 emissions.
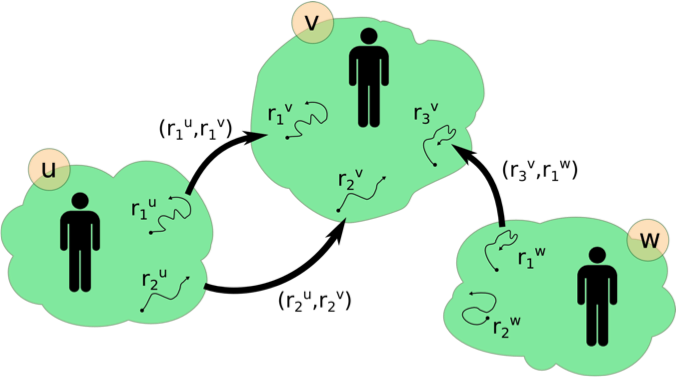
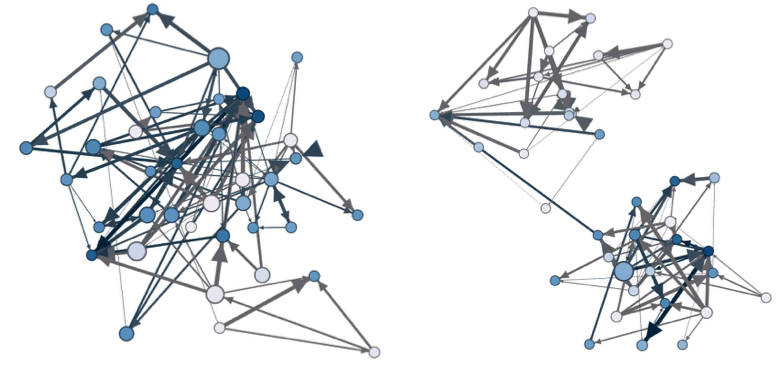
A carpooling network is a multi-dimensional graph where the nodes represents the set of all users taking part in at least a carpooling interaction, and the edges means the routine containment: origin node can be a passenger of the destination node.
Car Pooling Communities
Analyzing the possible matching between the users it is possible to detect communities which are "autonomous" or "not-autonomous". An autonomous community is a set of users which potentially can satisfies it own needs in terms of passengers and drivers. On the map some autonomous community is shown in different colors.
The graph of Passenger and Driver is used to create a set of reccomendations which can be used in a real proactive carpooling application. Moreover the simulation of this service reveals that accepted recommendation can be used to "learn" which are the most appropriate strategies to improve the next set of assignements.